INFOGRAPHICS
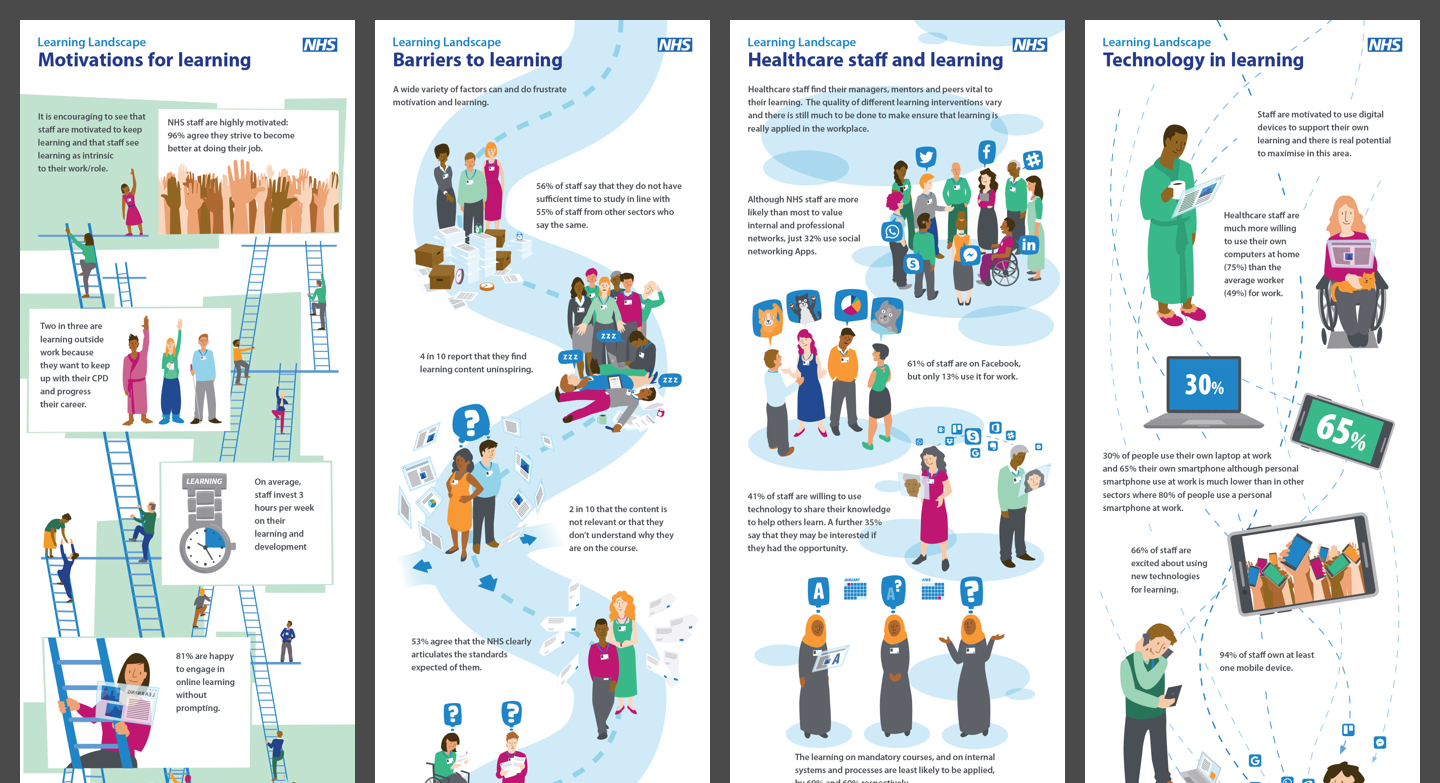
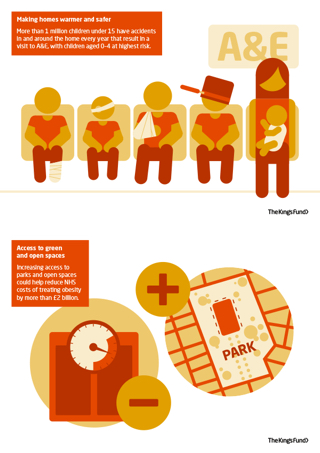
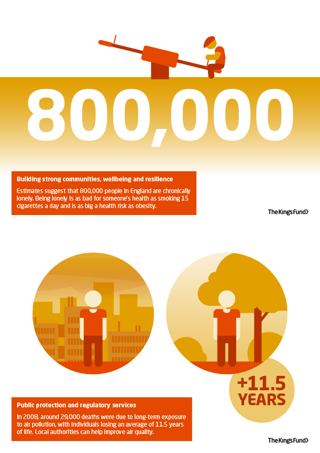
Use beautiful data visualisation to communicate complex statistic, analytics, and other forms of data to wider audiences.
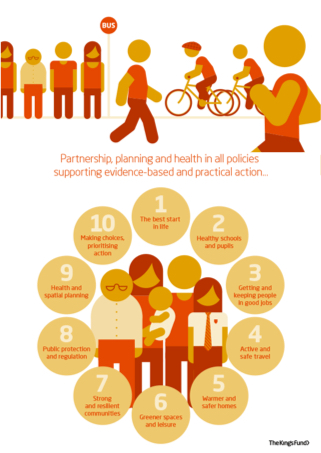
Either as static images or dynamic, interactive, clickable infographics our team has vast experience of helping not for profits and charities present their data in unique and easy to understand ways.
REQUEST CALL-BACK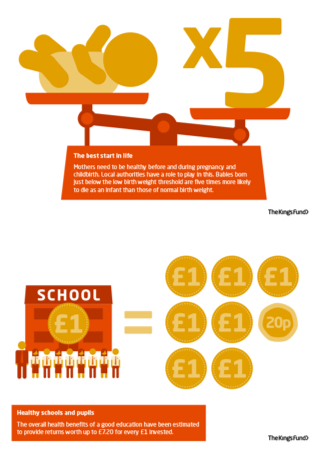

SERVICE LEVELS_
-
 GREAT
GREAT 1 data visualisation chart1 creative route1 round of changes1 day
 -
BETTER1 long-form infographic including 6 sub stats2 creative routes2 rounds of changes 3 days
-
BEST4 long-form infographics including 6 sub stats each2 creative routes2 rounds of revision 6 days
CUSTOM
Need something different? Just get in touch and we can discuss it.